Every morning, Happy Wick greets you with a personalized briefing — total market cap, 24h change, and an animated bull or bear that mirrors the market's mood. Track the Fear & Greed Index, BTC's MVRV ratio, the US Dollar Index (DXY) and the 10-Year Treasury Yield at a glance, then let our AI turn it all into one plain-English summary of what's actually happening. Dig deeper with BTC dominance, futures long/short ratio and open interest, or check stablecoin dominance and a full breakdown of USDT, USDC, DAI and more. And when you want the full story, our news feed pulls the latest headlines from 50+ trusted sources — all in one place, in under 30 seconds.
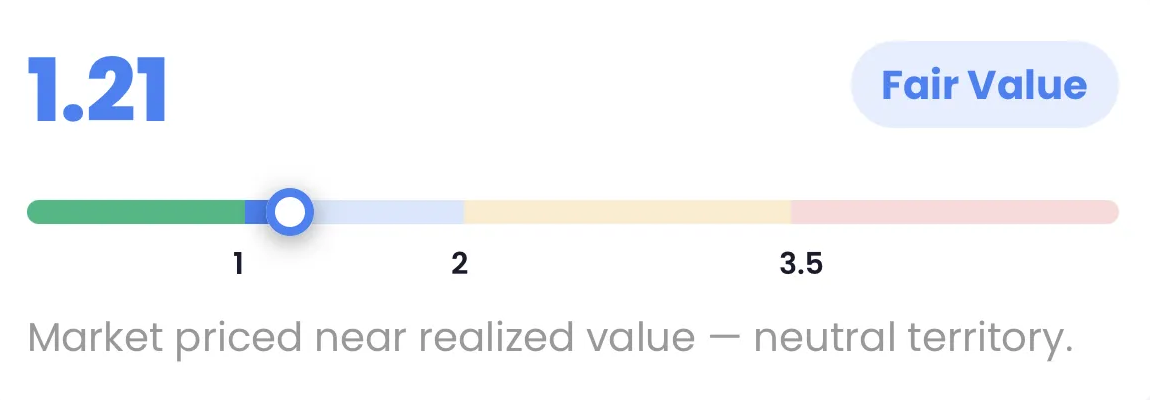
MVRV compares Bitcoin's market cap to its realized cap — what holders actually paid for their coins. Below 1.0 signals holders are underwater (historically a buy zone), 1.0–2.0 is fair value, 2.0–3.5 is overvalued, and above 3.5 has historically marked market tops.
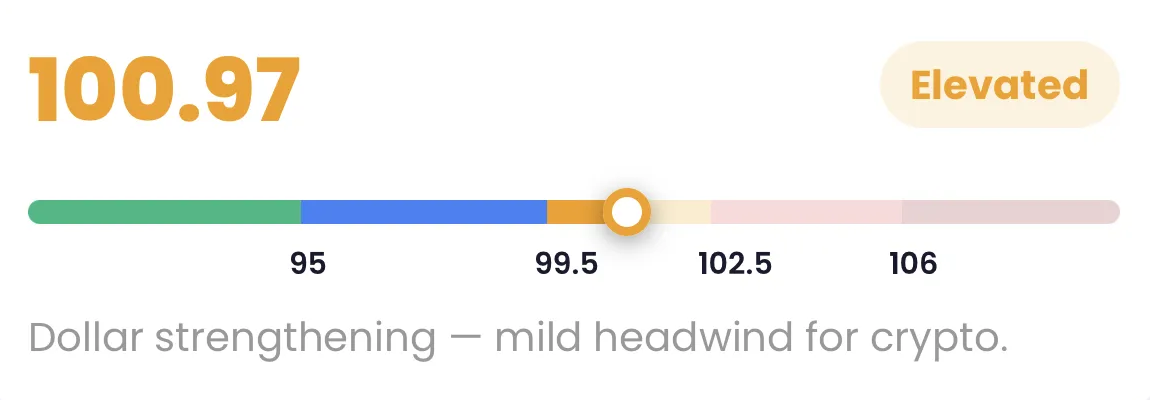
The ICE U.S. Dollar Index tracks dollar strength against a basket of major currencies (euro, yen, pound and more). It moves opposite to crypto — a strengthening dollar tends to pull money out of Bitcoin, while a weakening dollar often fuels rallies.
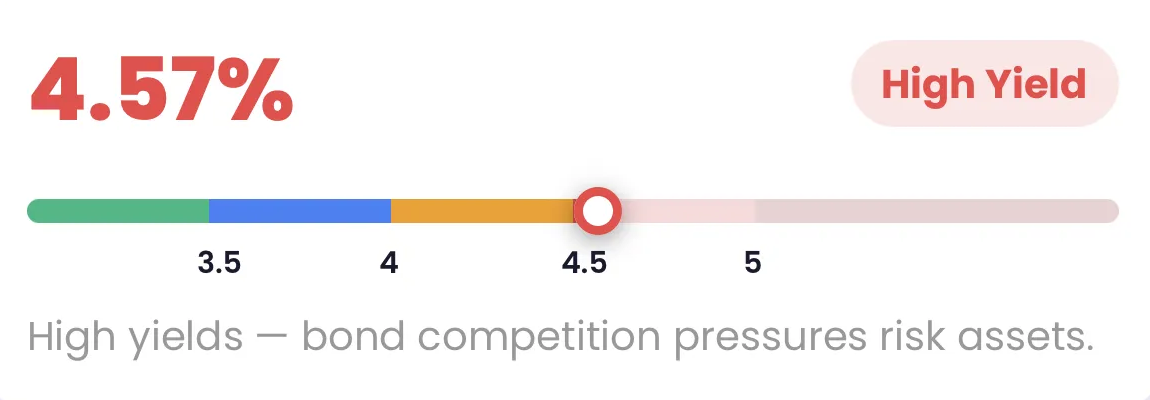
The US 10-Year Treasury Yield is the benchmark interest rate on US government bonds. Rising yields make "safe" bonds more attractive and pull money away from risk assets like Bitcoin; falling yields tend to push investors back toward crypto.
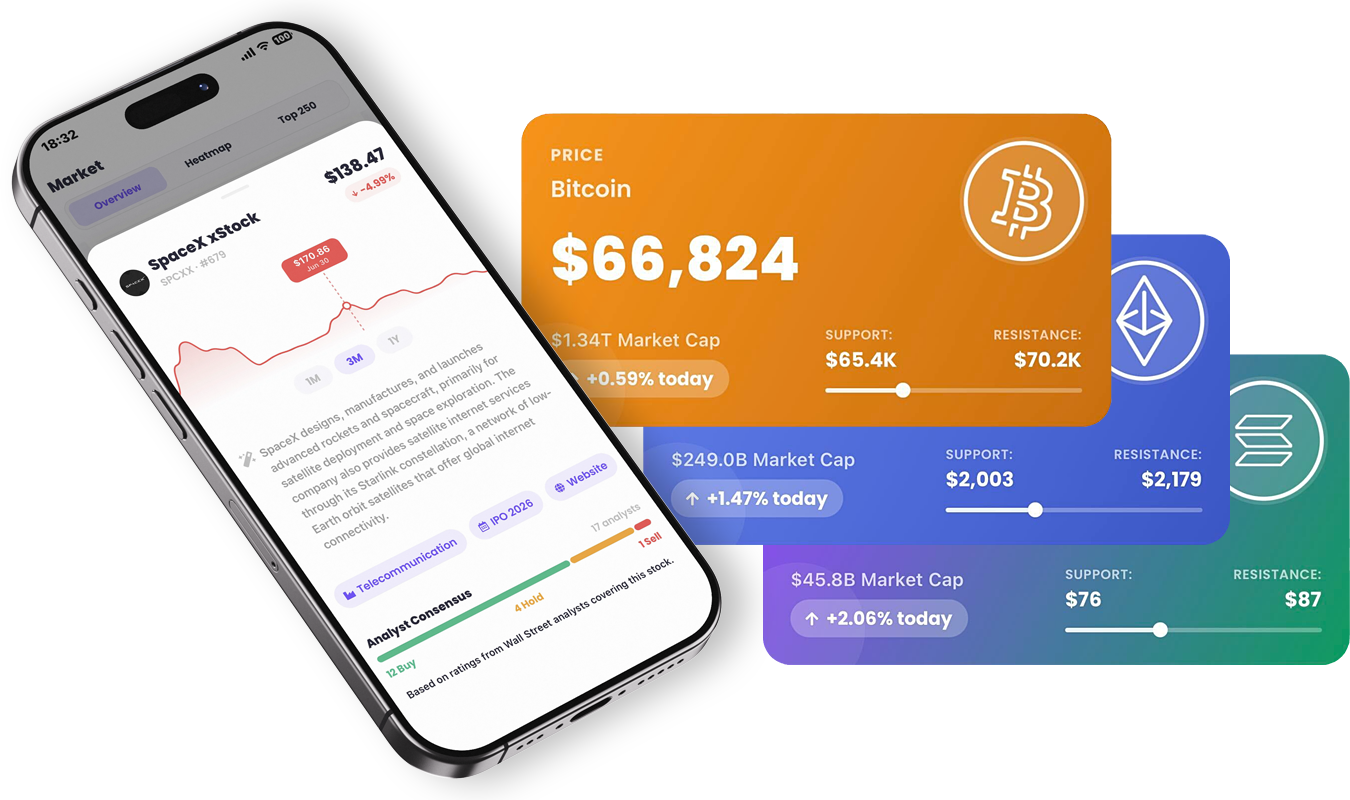
Follow live BTC, ETH and SOL prices with support & resistance levels, Bitcoin's 200-week SMA and real-time Ethereum gas fees, then flip through the day's Top Gainers and Losers. Trade the trend with tokenized stocks like SPYx, QQQx and TSLAx, each backed by an Analyst Consensus based on ratings from Wall Street analysts. Search and sort the full top 250 coins by price or market cap, or scan the color-coded Heatmap to spot momentum at a glance — then tap into any asset for its full chart history, ATH/ATL range, supply data and description.
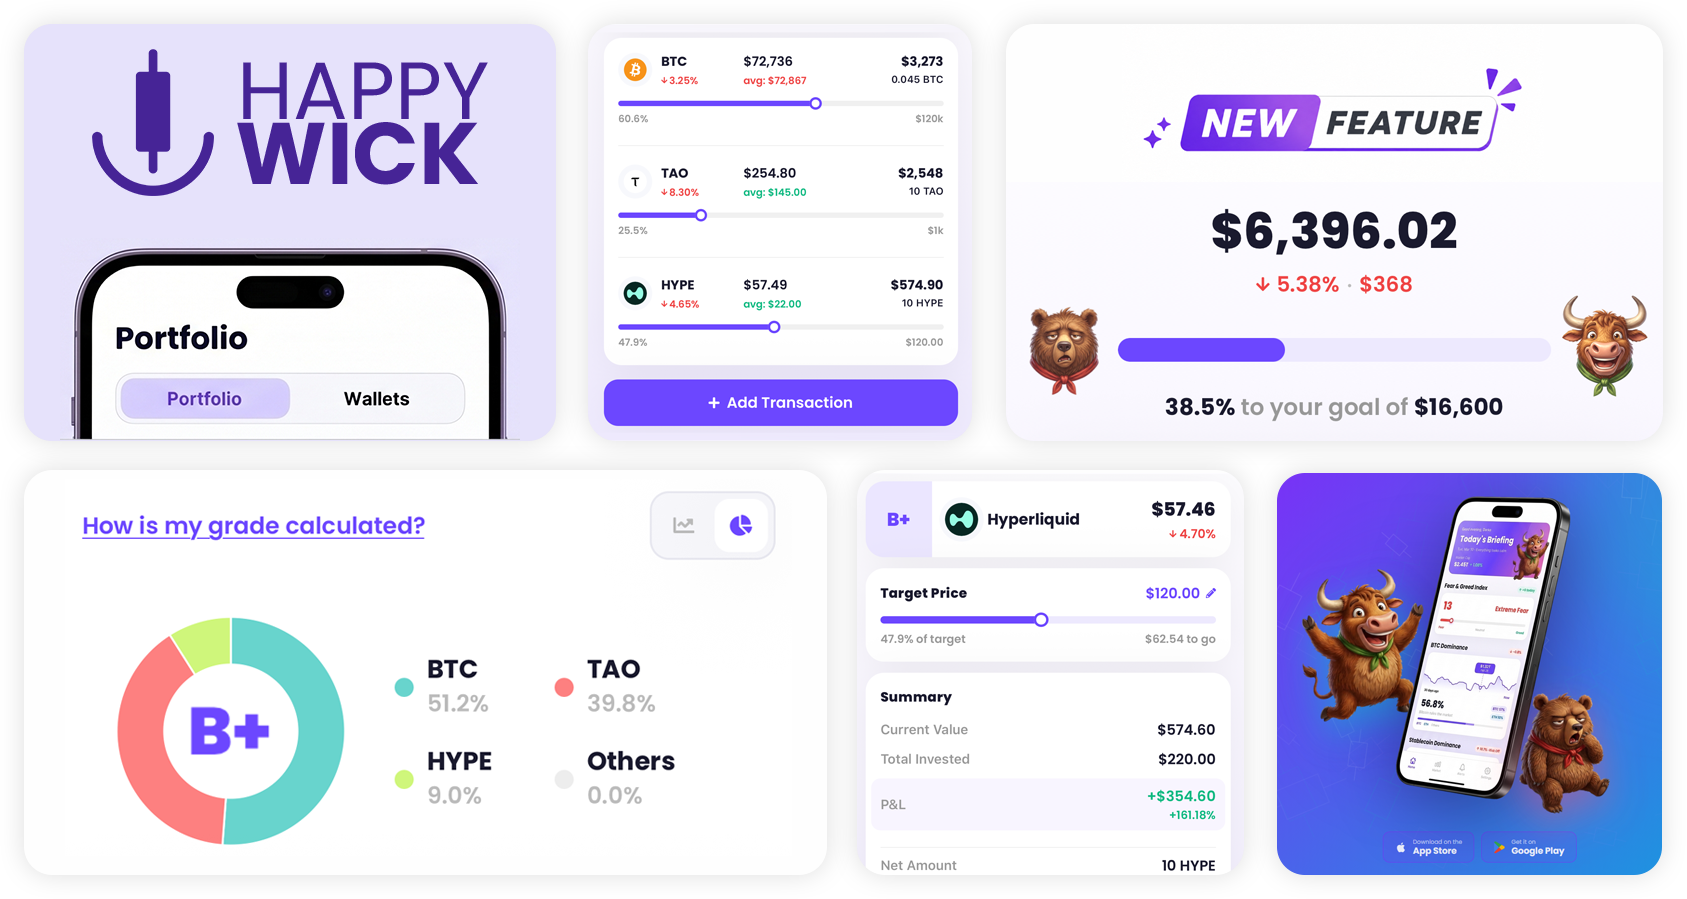
See your total value, how much you've invested, and your 24h change at a glance, with a goal bar that tracks your progress toward the sell targets you've set. Switch between a historical performance chart in USD and BTC, or a portfolio breakdown with a weighted Portfolio Grade (A+ to F) that scores your holdings by risk — from blue-chip assets down to speculative micro-caps. Every holding shows your average buy price, live P/L, and a progress bar toward its target price, and logging a new buy or sell takes seconds.
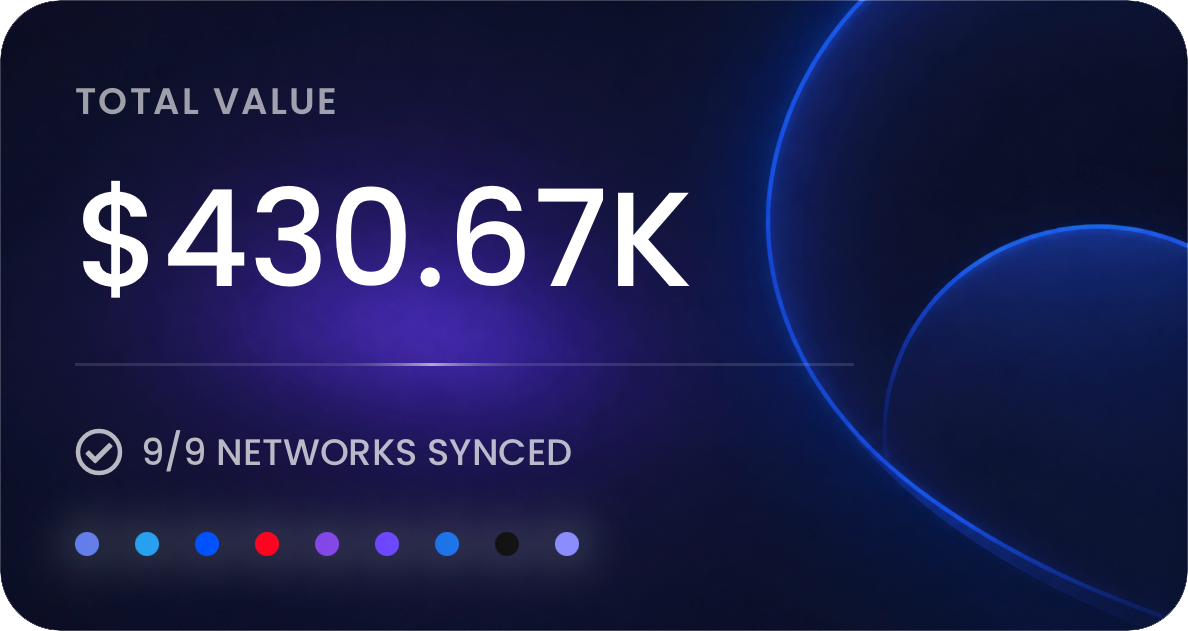
Add a Bitcoin address or an EVM wallet and Happy Wick tracks it across 9 chains — Ethereum, Arbitrum, Base, Optimism, Polygon, Ink, Immutable, Linea and zkSync — showing your balance, token holdings and recent transactions on every one. The moment a new transaction lands on any wallet, you get a push notification, so you always know what's moving before you even open the app. No wallet connection required — just paste in any public address you want to keep an eye on.
Happy Wick keeps watch even when you're not looking. Get a daily briefing notification summarizing Fear & Greed, BTC dominance and total market cap at the time you choose, plus instant alerts the moment sentiment swings 10+ points, BTC dominance crosses a key threshold, or any coin moves 5% or more in a day. Add your wallets and you'll know the second a new transaction lands — no more manually checking a block explorer. Support and resistance breakouts on BTC, ETH and SOL are flagged automatically too, so you never miss the moment a level gives way.